You've invested in a sales team, purchased expensive CRM software, and established targets—but your sales numbers are still falling short. Your sales reps are becoming frustrated and burnt out because they can't sell enough, despite their known selling abilities. The problem might not be your people, but rather how you're measuring and optimizing their performance.
"I have had 7 different sales people on staff over the past two years and none of them have performed very well, even the ones that are known to be great sales men," confessed one sales manager on Reddit.
With countless sales performance metrics available, how do you know which ones truly matter for your specific business situation? As another sales operations professional noted, "It varies depending on the company goals" - making the selection of metrics a strategic decision rather than a one-size-fits-all approach.
This article will cut through the noise by defining 20 crucial sales performance metrics and, more importantly, offering a strategic guide on how to prioritize them to diagnose sales process bottlenecks, coach teams effectively, and drive predictable revenue growth.
Before diving into specific metrics, it's important to distinguish between two related but different concepts:
The second category is where the real insights live. When analyzed properly, sales performance metrics allow you to:
1. Number of Calls or Emails Per Rep The total outreach activities logged by each sales representative. This provides a baseline for sales productivity and effort. High activity should correlate with positive outcomes; if not, it signals an issue with quality or targeting.
2. Number of Meetings Booked The total number of meetings or demos scheduled with prospects. This is a key leading indicator showing if outreach is effectively converting into meaningful conversations.
3. Lead Response Time The average time it takes for a sales rep to follow up with a new lead. Speed is critical—faster response times significantly increase the odds of qualifying and converting a lead. Calculation: Average of (Time of First Response - Time of Lead Receipt)
4. Number of Leads Generated The total count of new potential customers added to the sales pipeline within a specific period. The top of the funnel is essential for maintaining growth. A lack of leads is a primary cause of team burnout, as noted by users who state, "we do not have a way to provide direct leads to a sales team."
5. Sales Cycle Length The average amount of time it takes to close a deal, from initial contact to the final signature. A shorter sales cycle means faster revenue recognition and a more efficient process. Calculation: Total Days to Close All Deals / Total Number of Closed Deals
6. Sales Velocity A measurement of how quickly deals are moving through your pipeline and generating revenue. As one sales professional noted on Reddit, this is a powerful metric because it "includes 4 different metrics in one: average deal size, created pipeline, win rate, and average sales cycle." Calculation: (Number of Opportunities × Average Deal Size × Win Rate) ÷ Average Sales Cycle Length
7. Pipeline Value The total potential dollar value of all open opportunities currently in your sales pipeline. This is a forward-looking indicator of potential revenue. Sales leaders often look for a pipeline value that is a multiple (e.g., 3x-5x) of the quota to ensure goals are attainable.
8. Pipeline Coverage The ratio of your current pipeline value compared to your sales quota target. This answers the question: "Do we have enough in the pipeline to hit our target?" A ratio below 3x can be a cause for concern. Calculation: Total Pipeline Value / Quota Target
9. Deal Slippage Rate The percentage of deals that were forecasted to close in a given period but were pushed to a later date. High slippage rates undermine forecast accuracy and can indicate issues with deal qualification or sales process execution. Calculation: (Number of Deals Missing Close Date / Total Forecasted Deals) × 100
10. Lead-to-Opportunity Ratio The percentage of leads that are qualified and converted into active sales opportunities. This measures the quality of leads coming from marketing and the effectiveness of the initial qualification process by sales reps. Calculation: (Number of Qualified Opportunities / Total Number of Leads) × 100
11. Opportunity-to-Win Ratio (Win Rate)The percentage of qualified opportunities that result in a closed-won deal. This is a direct measure of the sales team's effectiveness at closing deals. It's a fundamental component of Sales Velocity and revenue forecasting. Calculation: (Number of Closed-Won Deals / Total Number of Opportunities) × 100
12. Conversion Rate by Sales Stage The percentage of deals that advance from one stage of the sales funnel to the next. As recommended by experienced sales professionals, "Focus on stages with the biggest drop-off." This metric helps pinpoint exactly where deals are stalling or being lost, allowing for targeted intervention.
13. Quota Attainment The percentage of the sales team that is meeting or exceeding their assigned sales quota. The ultimate measure of individual and team performance against goals. Consistently low attainment across the team can signal issues with quotas, training, product, or lead flow. Calculation: (Total Sales Achieved / Sales Quota) × 100
14. Average Deal Size The average revenue generated per closed deal. A core component of revenue planning and Sales Velocity. Increasing this metric through upselling or focusing on higher-value clients can dramatically impact overall revenue. Calculation: Total Revenue from Closed Deals / Total Number of Closed Deals
15. Customer Lifetime Value (CLV)The total predicted revenue a business can expect from a single customer throughout their entire relationship. This shifts focus from short-term wins to long-term, profitable relationships. High CLV indicates strong customer satisfaction and retention.
16. Customer Acquisition Cost (CAC)The total cost associated with acquiring a new customer, including all sales and marketing expenses. This must be compared against CLV to ensure a profitable business model (CLV should be significantly higher than CAC).Calculation: Total Cost of Sales and Marketing / Number of New Customers Acquired
17. Sales Growth Rate The rate at which your sales revenue is increasing or decreasing over a specific period. A top-line indicator of business health and market traction. Calculation: ((Current Period Sales - Previous Period Sales) / Previous Period Sales) × 100
18. Churn Rate The rate at which customers stop doing business with you over a given period. High churn can cripple growth, even with a strong new business engine. It's a critical indicator of customer dissatisfaction or poor product-market fit. Calculation: ((Customers at Start of Period - Customers at End of Period) / Customers at Start of Period) × 100
19. Net Promoter Score (NPS)A customer loyalty and satisfaction metric taken from asking customers how likely they are to recommend your product or service. This measures customer satisfaction, which is a leading indicator of retention, churn, and the potential for referral business. Calculation: % Promoters - % Detractors
20. Sales Forecast Accuracy A measure of how close your team's sales forecast is to the actual sales results. Accurate forecasting is crucial for business planning, resource allocation, and managing expectations. Calculation: 1 - [|(Forecast Amount - Actual Amount)| / Actual Amount]
Having listed 20 valuable sales performance metrics, the question remains: which ones should you prioritize? The answer isn't universal, as one sales operations professional rightly pointed out: metric importance "varies depending on the company goals."
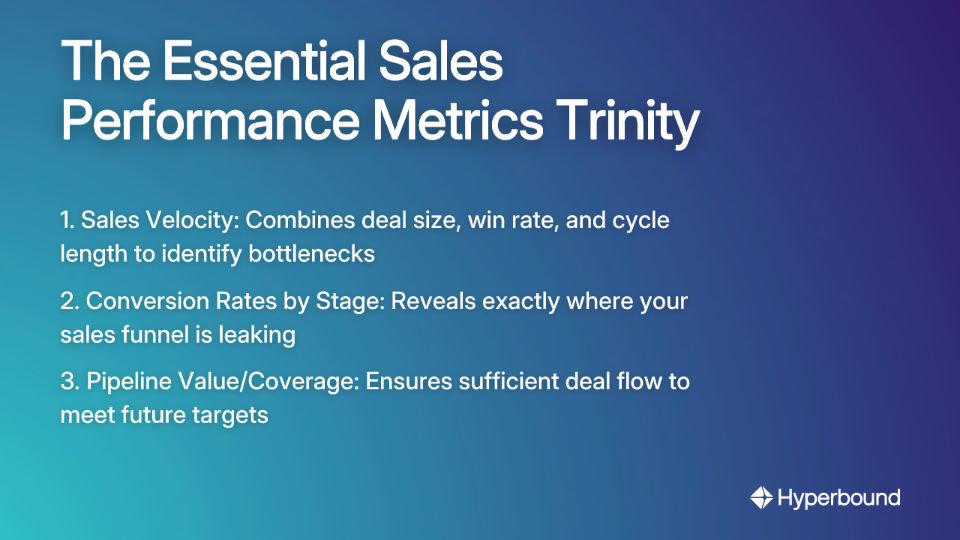
Based on insights from sales professionals, these three metrics form the core foundation of effective sales performance measurement:
The metrics you prioritize should vary based on your business model:
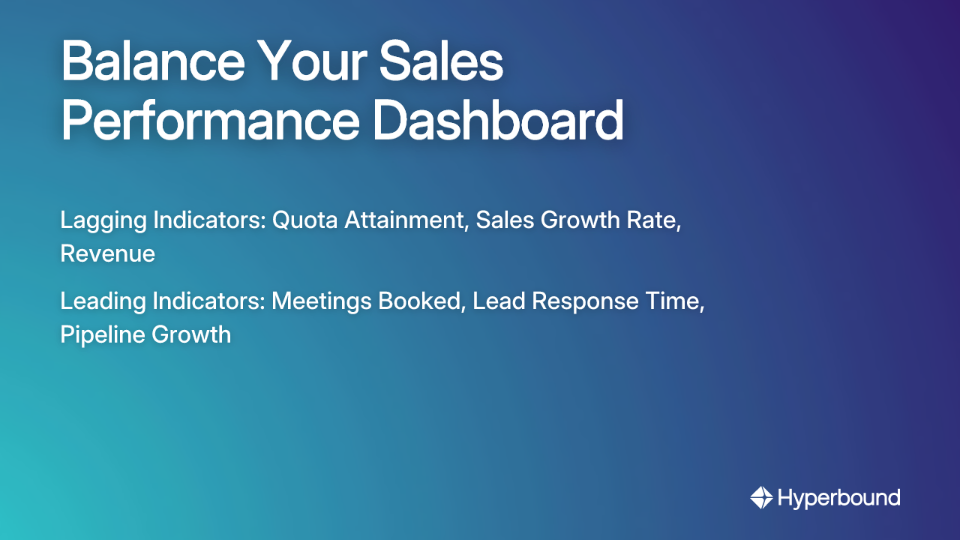
A high-performing team needs a dashboard with a healthy mix of both:
Having too many metrics can be as bad as having none. Focus on your prioritized "trinity" and a few key supporting metrics. Use dashboards to visualize the most important data, and don't track a metric if you don't have a plan for how you will act on the information.
Sales reps often see metrics as "big brother," and the "burden of data entry in CRMs" is a common complaint. Frame metrics as tools for coaching and improvement, not punishment. Automate data entry wherever possible, and clearly communicate why the data is being collected and how it helps them win more deals and earn more commission.

Garbage in, garbage out. Inconsistent data entry leads to unreliable metrics. Establish clear, objective criteria for each sales stage. One sales operations expert emphasized that "objective criteria around the funnel staging is far more important" than sales velocity itself. Conduct regular data audits and provide ongoing training on CRM usage. To complement this, platforms like Hyperbound provide an objective data layer by automatically scoring calls against a consistent rubric, reducing reliance on subjective manual entry.
Effective sales performance management isn't about tracking 20 different numbers; it's about prioritizing the vital few that align with your strategic goals. Start by evaluating your current sales process, choosing a small, balanced set of leading and lagging indicators, and using the insights to have more productive conversations with your team.
Remember, the ultimate goal of using sales performance metrics is not just to hit a number, but to build a more efficient, predictable, and sustainable sales engine that empowers salespeople to succeed and reduces the burnout that plagues so many teams.
The most important sales performance metric depends on your specific company goals, but a powerful, all-in-one metric is Sales Velocity. It provides a comprehensive health check of your sales process by combining the number of opportunities, average deal size, win rate, and the length of your sales cycle into a single number that measures how quickly your team is generating revenue.
To fix a sales process with high activity but poor results, you should analyze your Conversion Rate by Sales Stage. This metric pinpoints the exact stage in your sales funnel where deals are stalling or being lost. By focusing on the stages with the biggest drop-offs, you can identify the root cause—such as poor qualification or ineffective demos—and provide targeted coaching to improve performance.
The key difference is that leading indicators predict future outcomes, while lagging indicators measure past results. Leading indicators include metrics like meetings booked and lead response time, which give you an early look at future success. Lagging indicators, such as quota attainment and sales growth rate, tell you what has already been achieved. A healthy sales dashboard balances both to manage current activities and forecast future performance accurately.
A sales team should avoid "analysis paralysis" by focusing on a small, manageable set of 3 to 5 core metrics at any given time. Start with the "must-track" trinity: Sales Velocity, Conversion Rates by Stage, and Pipeline Coverage. Then, add 1-2 other metrics that are most relevant to your current strategic goals, ensuring a mix of leading and lagging indicators.
Sales pipeline coverage is important because it answers the critical question: "Do we have enough potential deals in our pipeline to hit our future sales target?" It is calculated by dividing your total pipeline value by your quota target. A healthy pipeline coverage ratio (often 3x to 5x your quota) acts as a forward-looking safety net, ensuring your team has sufficient opportunities to meet its goals.
To get buy-in from your sales team, frame metrics as tools for coaching and improvement, not for punishment. Clearly communicate how tracking specific data helps them win more deals and earn more commission. You can also reduce resistance by automating data entry where possible to ease the CRM burden and using the insights to provide personalized, constructive feedback.











Use Cases
Legal