
You've invested in a flashy sales dashboard with colorful charts and comprehensive metrics. Your team requested it, the executives approved it, and now it sits largely ignored while your sales reps continue to ask, "What should I do next?" This scenario plays out in companies everywhere - a classic case of being data-rich but insight-poor.
As one sales leader candidly observed on Reddit, "Sales folks ask for things all the time but rarely use them. They're kinda like little kids who see shiny toys, whine until their parents buy it for them, and only play with it for 2 hours." This frustration highlights a fundamental disconnect: most sales dashboards fail because they're designed as passive data repositories rather than active decision-making engines.
Your dashboard isn't working because it answers "what happened?" but fails to address the critical question every sales professional asks daily: "What do I need to do now?"
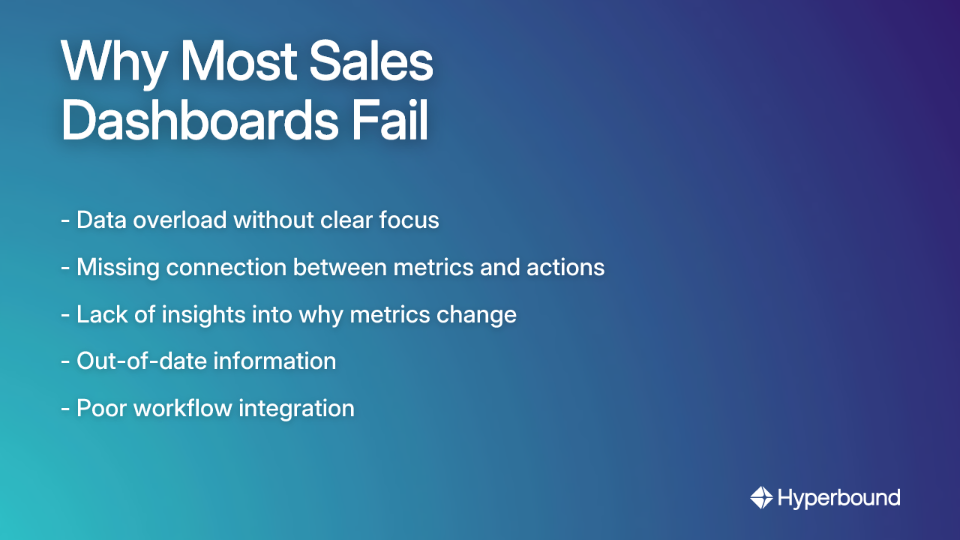
Sales teams collect vast amounts of data, but disorganized presentation makes it impossible to identify crucial metrics that impact outcomes. When dashboards try to show everything, they effectively communicate nothing.
The most telling question you can ask about any metric on your dashboard is: "If this number looks bad, what specific action should we take?" As sales professionals have noted, "9 times out of ten, they don't have an answer, so the dashboard won't provide any benefit." Without clear connections to actions, even the most sophisticated dashboard becomes just another pretty screen.
Basic dashboards show what is happening (e.g., conversion rates are down) but lack insights into why. This leaves managers unsure about how to allocate resources or what coaching is needed. Effective dashboards must bridge this gap by correlating insights with actions. If you can't draw a straight line from a metric to a specific action, the dashboard is just a collection of numbers.
"If the dashboard is always a day behind, it loses relevance once I start my day," explains one sales executive. Sales is a real-time activity, and yesterday's data might as well be ancient history when a rep is deciding which prospect to call next.
A dashboard that exists in isolation will be ignored, no matter how informative it might be. The critical question is: "Can I take the next action fluidly?" As one sales leader puts it, "If I need to open a different system, start a ticket, and do something else, then I won't bother." When dashboards create extra work rather than streamlining it, adoption plummets.
As one sales professional bluntly stated, "Performance metrics don't drive sales." The hard truth is that many dashboards focus on vanity metrics that look impressive in boardroom presentations but fail to drive daily actions on the sales floor.
Focus on metrics that directly influence revenue and can be impacted by specific sales activities:

A fatal mistake in dashboard design is the one-size-fits-all approach. It's also critical to recognize that different sales roles need different KPIs:
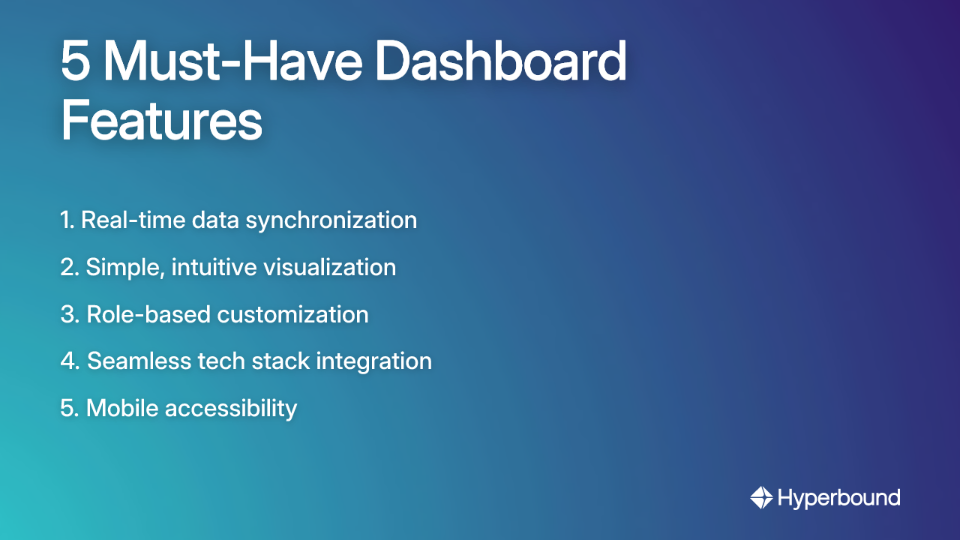
Dashboards must provide a live view of sales activities and outcomes. Automatic updates ensure that sales processes are reflected as they change, allowing for immediate course corrections rather than week-old insights.
The most-used dashboards are "super simple, show pipeline movement, deal risks, and maybe a quick view of what needs action today." The guiding principle should be "One screen, no hunting," as sales professionals have noted. When a dashboard requires scrolling, clicking, or deciphering complex visualizations, it's already failed.
Tailor views for different roles to ensure each team member receives only the information relevant to their responsibilities. The dashboard needs to "appeal to account execs and their specific needs based on product/industry," according to sales managers.
To become part of the workflow, dashboards must connect with other tools in your tech stack. A modern dashboard should function as a unified hub that pulls information from your CRM, email tools, and call platforms. This enables reps to take action directly from the dashboard, preventing it from becoming an isolated island of data.
Sales teams are rarely desk-bound. Dashboards must be designed to work on mobile devices, keeping teams connected to critical data whether they're in the office, traveling, or meeting with clients.
Even with solid dashboard metrics, favorable numbers can often mask underlying issues in the sales process. Workweek.com points out that dashboards tell you what happened; qualitative analysis tells you why.
Call reviews reveal issues that dashboards miss entirely:
For example, if your dashboard shows a lower-than-benchmark 15-17% connect-to-opportunity rate for outbound efforts, call reviews are the next step to diagnose the problem.
Manually reviewing calls is time-consuming and doesn't scale. This is where AI Sales Coaching platforms like Hyperbound come in. Hyperbound analyzes thousands of your team's sales calls to identify the winning behaviors of your top performers. It then uses these insights to create hyper-realistic AI roleplays where reps can practice and master critical conversations—from cold calls to objection handling—in a safe environment. This approach turns qualitative insights into a scalable coaching program that directly addresses the performance gaps your dashboard can only hint at.
Before building anything, align the dashboard's purpose with specific business goals. What problem are you trying to solve? What decisions will this dashboard inform?
Don't build in isolation. One successful approach from a Reddit user is to "force all of them to come up with things they want, collectively." This creates ownership and ensures the final product meets real-world needs.
Users often don't know what they want until they see it. The best practice is to "expedite a basic but usable dashboard to show what can be done, and add the details in later." Launch a minimum viable version, then regularly gather user feedback for continuous improvement.
The guiding design principle should be that "dashboards should be centered around taking action." Build features that tell the salesperson what to do next based on the data. For example, create a dedicated view for driving sales in low-performing locations with specific campaign suggestions.
An effective sales dashboard is not a passive report; it's an active decision-making engine that provides real-time, simple, and role-specific views. It prioritizes actionable insights over vanity metrics and always answers "what's next?"
The ultimate goal is to move from data overload to data-driven decision-making. By combining quantitative metrics from a well-designed dashboard with qualitative insights from practices like call reviews, you create a powerful coaching and performance engine.
Stop asking your team to use a dashboard that doesn't work for them. Instead, collaborate to build a tool that simplifies their workflow, clarifies their next steps, and turns raw data into predictable revenue growth. When you achieve this, your dashboard will no longer be a neglected "shiny toy" but an indispensable part of your sales team's daily routine.
Most sales dashboards fail because they are data-rich but insight-poor. They present a vast amount of information without telling a sales professional what they should do next. Common reasons for failure include data overload, a lack of connection between metrics and actions, stale data, and poor integration into the team's daily workflow.
An actionable dashboard transforms data into clear next steps for the user. It achieves this by providing real-time data, using simple and intuitive visualizations, offering role-based views tailored to individual responsibilities, and integrating seamlessly with other sales tools. An actionable dashboard answers the question, "Based on this data, what is my next move?"
The most important KPIs are those that directly measure activities that drive revenue. Instead of vanity metrics, focus on actionable KPIs like Sales Pipeline Velocity, Lead Conversion Ratios by stage, Customer Acquisition Cost (CAC), and specific Sales Activity Metrics (e.g., calls made, meetings booked). These metrics provide a clear view of performance and highlight areas for improvement.
To increase adoption, involve your sales team in the design and iteration process. Start by building a simple, usable dashboard that solves a specific, high-priority problem. Ensure it integrates with their existing tools to avoid creating extra work. Most importantly, build the dashboard around actionable outcomes, so it becomes a tool that helps them perform better, not just a report they have to check.
An actionable KPI is a metric that can be directly influenced by a salesperson's daily activities and leads to specific business decisions. For example, "meetings booked per week" is an actionable KPI. A vanity metric might look impressive but doesn't offer clear guidance, such as "total leads generated" without context on lead quality or conversion rates.
Dashboards and call analysis provide a complete view of sales performance. A dashboard tells you what is happening (e.g., a low lead-to-opportunity conversion rate), while call analysis tools like Hyperbound tell you why it's happening (e.g., reps are struggling with objection handling). Using them together allows you to diagnose performance issues accurately and provide targeted coaching.
No, a one-size-fits-all dashboard is rarely effective. Each role has different needs and priorities. Sales reps require a view focused on their personal activities and pipeline. Sales managers need team performance metrics and coaching opportunities. Executives need high-level trend data and forecasting. A successful dashboard provides customized, role-based views for each user.











Use Cases
Legal