
Are you drowning in sales data but starving for actionable insights? Many sales leaders feel overwhelmed, staring at dashboards where the "pipeline information is often too vague" or the metrics don't seem to drive productive behavior. The struggle is real, as sales leaders often lack the tools to effectively "study their craft."
The "one-size-fits-all" dashboard is a myth. As one sales operations professional aptly put it, "business models, sales processes, leadership is all different and can have a wide variety of needs." What works for one team might completely miss the mark for another.
This guide will cut through the noise. We'll provide a clear framework for selecting the right metrics for your team, building dashboards that provide high-level, actionable information, and ultimately driving predictable revenue growth in 2026.
A dashboard is more than a data repository; it's a decision-making tool. Its purpose is to align the entire sales organization on the metrics vital for company growth. Yet many dashboards fail to deliver on this promise.
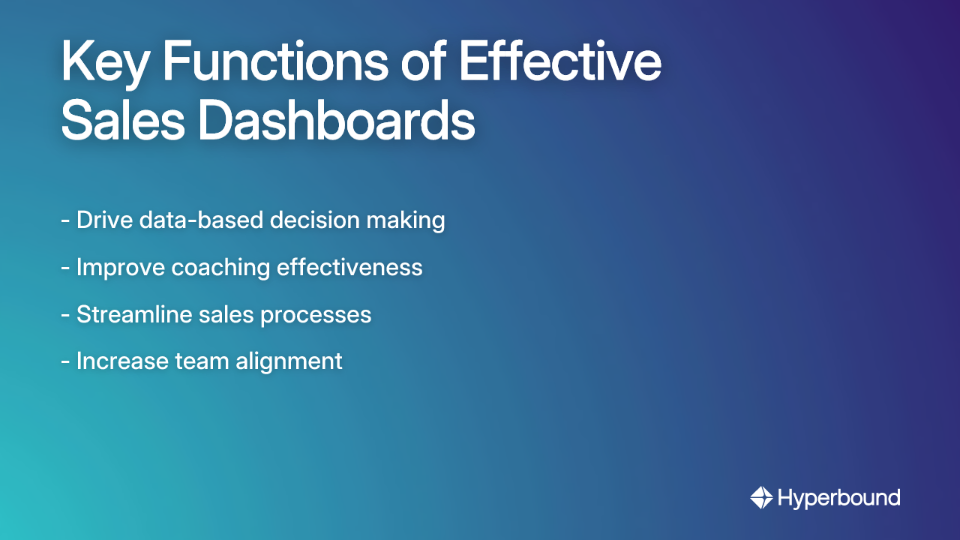
Effective dashboards should:
The biggest mistake is creating a single dashboard for everyone. As one Reddit user emphasized, "Understanding your audience can really help with the dashboard build." Different roles need different insights:
"The point of a dashboard is to provide high-level overview of actionable information," reminds a sales operations professional on Reddit. When you tailor your dashboards to specific audiences, you ensure everyone gets the insights they need without drowning in irrelevant data.
To build truly effective dashboards, you need a balanced set of metrics. Let's break down essential metrics into four clear categories:
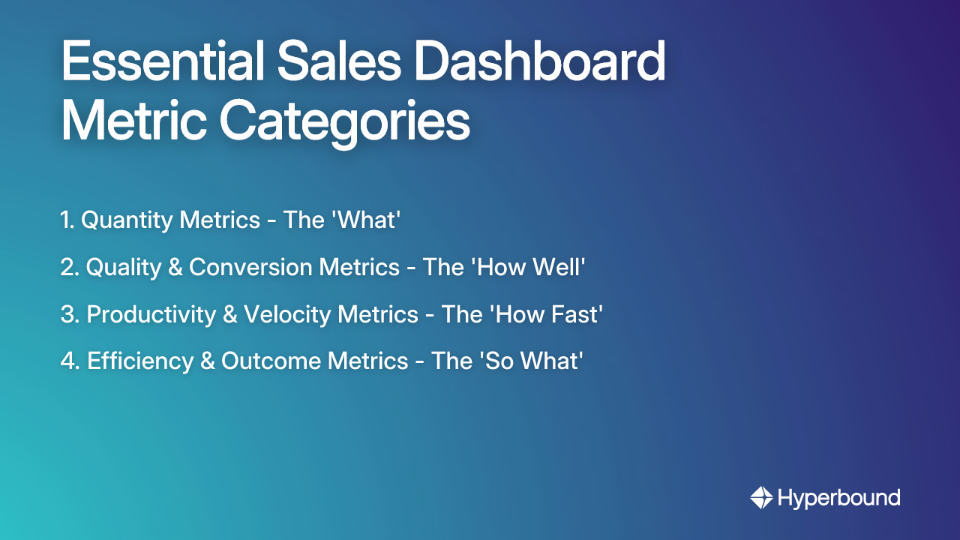
These metrics measure the volume of sales activities and are often leading indicators of future performance:
These metrics evaluate the impact of your sales strategies and help identify weak points in the sales funnel:
(Number of deals closed) / (Number of leads) x 100.These metrics assess the efficiency and speed of your sales process:

These metrics analyze how effectively resources are contributing to revenue and overall business health:
(Average purchase value/year) x (Average purchases/year) x (Average customer lifespan).
Let's move from theory to practice with concrete dashboard examples tailored to different needs, inspired by Geckoboard's dashboard examples:
Focus: High-level performance against monthly and quarterly targets.
Audience: Sales Manager, Sales Director, CEO.
Key Metrics: Performance to Monthly Revenue Target (%), Total Value of Pipeline, Deals Closed This Month, Historical Revenue (MoM).
This dashboard answers the critical question: "Are we on track to hit our revenue goals this month/quarter?"
Focus: Individual team performance and coaching opportunities.
Audience: Sales Manager, Sales Team.
Key Metrics: Rep Leaderboard (by revenue), Individual Progress to Target, Conversion Rate (by rep), Average Deal Size (by rep).
This dashboard helps identify which reps need coaching and in what areas, making it invaluable for sales managers focused on team development.
Focus: Real-time operations, ideal for high-velocity sales environments.
Audience: Sales Manager, Inside Sales Team.
Key Metrics: Average Close Time, Unassigned Leads, Lead Response Time, Current Call Queue.
Perfect for managers who need to make in-the-moment decisions about resource allocation and prioritization.
Focus: For businesses with a lag between order and payment.
Audience: Sales Manager, Finance Director.
Key Metrics: Invoices Issued This Month, Purchase Orders Placed This Month, Total Unbilled Orders (Order Book).
Especially useful for manufacturing, furniture, or other industries with extended fulfillment timelines.
The main purpose of a sales dashboard is to provide a visual, at-a-glance overview of key performance indicators (KPIs) to enable quick, data-driven decision-making. It transforms raw data into actionable insights, helping to align the sales team, improve coaching, and streamline processes by highlighting progress toward goals and identifying potential issues before they escalate.
To choose the right metrics, focus on a balanced set of KPIs that cover four key areas: Quantity (activity volume), Quality (effectiveness), Productivity (speed), and Outcomes (business impact). Always start by defining your business goals and the needs of the dashboard's audience (e.g., CEO, sales manager, or rep). Select metrics that are actionable and directly tied to achieving those goals, avoiding "vanity metrics" that don't drive productive behavior.
The biggest mistake is creating a one-size-fits-all dashboard that overwhelms users with irrelevant data. Different roles require different insights; a CEO needs a high-level strategic overview, while a sales rep needs to see their individual progress and activity pipeline. Tailoring dashboards to the specific audience ensures the information is relevant, actionable, and doesn't lead to data overload.
A good sales dashboard should ideally feature between 5 and 9 key metrics. The goal is clarity, not complexity. Too few metrics may not tell the whole story, while too many can cause confusion and inaction. Focus on the most critical KPIs that provide a clear, actionable snapshot of performance for a specific role or goal.
A leading indicator predicts future performance, while a lagging indicator measures past results. For example, the number of calls made (a leading indicator) is an input activity that can help predict future sales. In contrast, total revenue closed (a lagging indicator) measures the outcome of past activities. A balanced dashboard includes both to track current efforts and measure historical success.
A sales dashboard improves coaching by providing objective data that pinpoints specific areas where individual reps or the team as a whole need support. Managers can use metrics like conversion rates by stage, average sales cycle length, or win rates to identify skill gaps. This data allows for targeted, evidence-based coaching conversations instead of relying on gut feelings, leading to more effective team development.
The ideal frequency depends on your role and sales cycle. Generally, sales reps and managers in a high-velocity environment should review their dashboards daily to make real-time adjustments. Senior leadership might conduct a deeper review on a weekly or bi-weekly basis to track progress against quarterly goals. The key is to establish a consistent cadence that integrates the dashboard into your team's regular workflow.
An effective sales manager dashboard in 2026 is not a static report; it's a dynamic tool. It must be tailored to its audience, focused on a balanced set of metrics across quantity, quality, productivity, and outcomes, and designed to provide actionable insights.
The future of sales management relies on data-driven leadership. By moving beyond simple data dumps and building truly insightful dashboards, you empower your team, streamline your processes, and create a predictable engine for revenue growth. Integrating insights from AI coaching tools like Hyperbound can take your dashboards to the next level, connecting team performance metrics directly to the specific skills and behaviors that drive success.
Remember that the most successful dashboards evolve over time. Start with the metrics that matter most to your specific business context, gather feedback regularly, and refine your approach as your team's needs change. The first step is to ask what your team needs to see to be successful—and then build from there.










Use Cases
Legal