
Your CRM knows how many calls your reps made. It does not know if they asked the right questions.
That gap is where win rates get decided. And for most revenue teams, it is completely invisible.
The average B2B sales team closes only 21% of all opportunities. For enterprise deals over $100K, that number drops to 15%. Teams looking to move that needle often double down on activity tracking: more calls logged, faster response times, more meetings booked. The data gets cleaner. The dashboards get prettier. The win rate stays flat.
The problem is not a lack of data. It is a lack of the right data. Sales behavior analytics is a different category altogether. It connects specific selling behaviors to specific outcomes. Not how many calls a rep made, but what happened inside those calls.
One sales operations thread on Reddit illustrated the frustration well. A rep described wanting to know, out of 400 calls, what percentage of the time each objection came up, and what topics reps discussed in response. That is the question that creates coaching leverage. Most tools cannot answer it.
This post defines what sales behavior analytics actually are, which five metrics have the clearest link to win rate, and how to use that data to coach reps rather than just report on them.
Sales behavior analytics connect selling behaviors to performance outcomes. They answer the question: which specific actions, in which specific moments, separate deals that close from deals that do not?
This is different from activity analytics, which measure volume. It is also different from outcome analytics, which measure results after the fact. Behavior analytics sit in between. They measure the inputs that generate outcomes, which makes them the layer most directly tied to coaching.
There are three levels of analysis:
Call-level signals are the micro-view of individual conversations. What was the talk ratio? How many questions did the rep ask? How did they respond when a prospect raised a pricing objection? Revenue Activation Platforms can capture these signals at scale, tagging moments by type and scoring them against defined criteria.
Deal-level trends are the macro-view across the sales cycle. Is the prospect becoming more or less engaged over time? Are senior stakeholders showing up to calls, or is the rep still stuck with an individual contributor three stages in? These patterns reveal deal health long before the forecast does.
Rep-level vs. team patterns is where behavior analytics becomes a strategic tool. When you isolate what top performers consistently do differently from the rest of the team, you stop guessing about what good looks like. You have a benchmark. And benchmarks make coaching specific.
Together, these three layers form a picture that no CRM or spreadsheet can produce on its own.
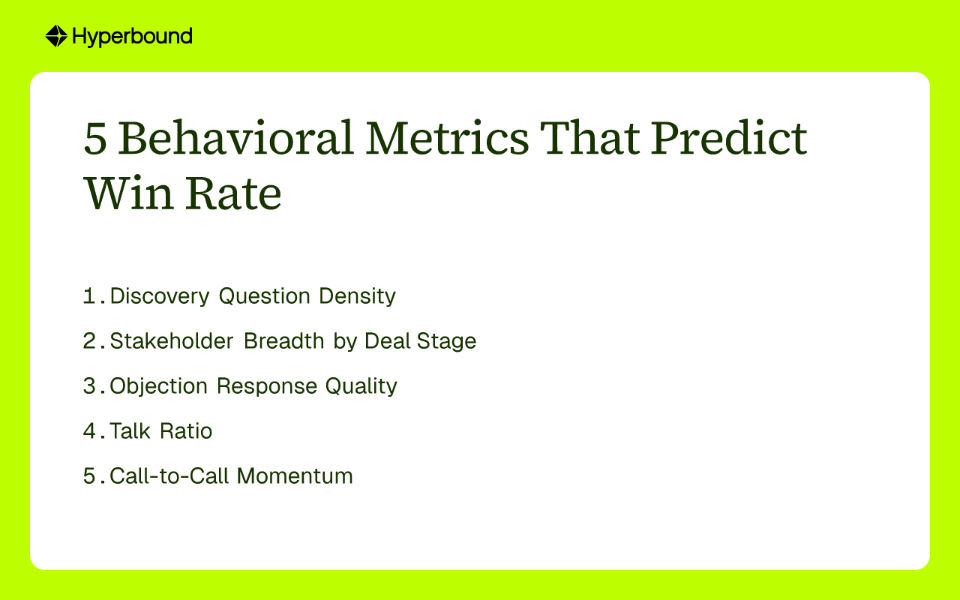
Discovery question density measures how many relevant, open-ended questions a rep asks per minute during discovery calls.
This metric matters because question volume in discovery is a proxy for thoroughness. Reps who ask more questions are uncovering pain points, mapping the buying process, and building the foundation for a strong business case. Teams using structured qualification frameworks like MEDDIC report 40% higher close rates, and high discovery question density is the behavioral expression of that discipline.
To track it: use call intelligence to flag questions and measure frequency on calls tagged as discovery. Compare rates across won and lost deals. The gap is usually significant.
This metric tracks the number of unique contacts, particularly senior decision-makers and economic buyers, engaged in a deal before it reaches late stages.
Single-threaded deals are fragile. Research shows that engaging three or more contacts per deal leads to 2.4x higher close rates. Yet many reps stay in their comfort zone with a single champion, hoping they will sell internally on the rep's behalf.
The behavioral question is: by Stage 2, has the economic buyer shown up on a call? If not, that is a coaching trigger. Not a forecast flag. A coaching trigger.

Objection response quality measures how a rep handles pushback in real time. A winning response follows a recognizable pattern: acknowledge the concern, reframe the issue, validate the prospect's perspective, then offer a path forward. A losing response either deflects or immediately pitches harder.
This is the metric that most call tools cannot reliably surface. Tagging that an objection occurred is not the same as analyzing how it was handled. The difference between those two things is the difference between activity data and behavior data.
To track it: identify your team's most common objections (pricing, timing, competitor preference), flag those moments in recorded calls, and build a scorecard that evaluates the rep's response against the acknowledge-reframe-validate structure. Cross-deal pattern analysis makes this scalable. You can see which response approaches correlate with deals that progressed versus stalled.
Talk ratio measures what percentage of a call the rep speaks versus the prospect.
Analysis of winning calls shows they tend to feature more listening than talking from the rep. A ratio that skews toward the prospect, say 40% rep to 60% prospect, typically indicates the rep is asking good questions and creating space for the buyer to articulate their priorities. A high rep talk ratio often signals premature pitching and underdeveloped discovery.
That said, talk ratio is a contextual metric. A high rep talk ratio on a technical demo call with an engaged buyer reads differently than a high rep talk ratio on a first discovery call with a cold prospect. Track it, but analyze it in context, not in isolation.
Call-to-call momentum tracks the trend in call duration as a deal progresses through the pipeline.
In healthy deals, calls tend to get longer and more substantive over time. Early conversations are exploratory. Later conversations involve legal, finance, security, and integration details. That depth takes time. Deals where calls are getting shorter later in the cycle are often stalling, even if the rep marks them as active in the CRM.
Deals that exceed the average sales cycle length by 50% or more have a dramatically reduced probability of closing. Call-to-call momentum is a leading indicator that catches those deals before they quietly die.
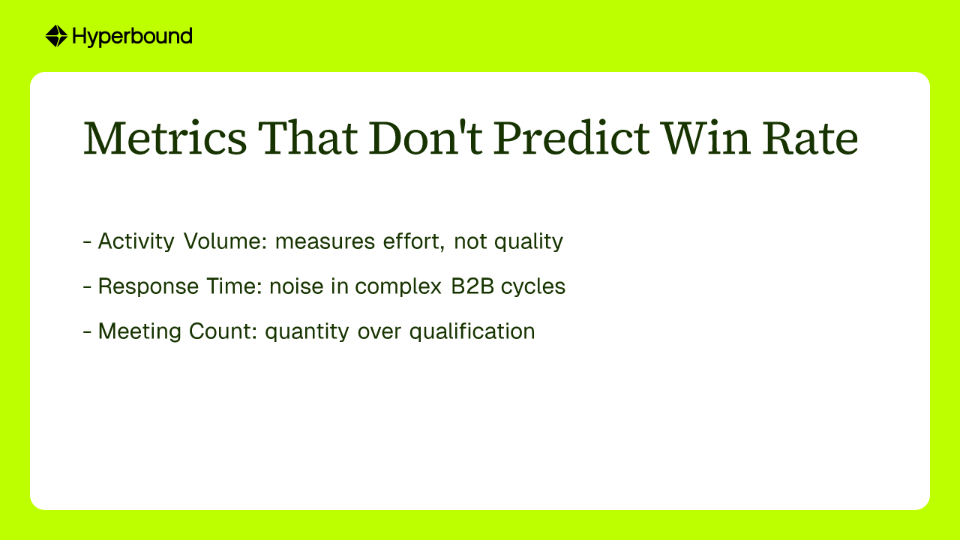
These metrics are popular because they are easy to measure. Not because they predict outcomes. They measure effort. Effort and effectiveness are not the same thing.
Activity volume. Call count, email count, and outreach sequences tell you a rep is busy. They do not tell you the calls were good, the emails were relevant, or the outreach was targeted. A rep can make 100 poor-quality calls and outperform nothing. The number is visible. The quality is not. That is why activity volume persists as a KPI even when it consistently fails to explain win rate variance.
Response time. Speed to first contact matters for inbound leads. Responding within five minutes correlates with a 21% higher win rate on fresh inbound inquiries. But as a general predictor across a complex B2B sales cycle? Response time is noise. What matters is not how fast the rep replied. It is what they said and whether it moved the deal forward.
Meeting count. This is the classic SDR metric that creates the wrong incentive. Booking more meetings sounds like pipeline growth. It can just as easily be pipeline pollution. Unqualified meetings consume AE time and dilute forecast accuracy. The metric that matters is meetings that convert to the next stage, not meetings that exist.
All three of these metrics are widely reported because they are simple to pull from a CRM. They create the appearance of analytical rigor without producing the insight that actually changes rep behavior.
Behavior analytics is not a reporting upgrade. It is only useful if it changes what happens in a coaching conversation.
The failure mode is using behavioral data the same way teams use activity data: as a summary to review on a dashboard and move on from. That changes nothing. The rep learns their talk ratio was high last week. They nod. Nothing shifts.
The better approach is to use behavioral signals as triggers for specific, targeted coaching moments.
Instead of: "Your talk ratio was 72% last week."
Try: "I pulled the recording from your ACME discovery call. At the 14-minute mark, you started explaining the product before you confirmed the prospect's actual priority. Let's look at that moment and build three questions you could have asked instead."
That conversation is possible because the behavioral data pointed to a specific moment. Companies with structured coaching programs built on this kind of specificity see as much as a 28% improvement in sales performance. The structure matters as much as the data.
A repeatable process looks like this:
Richardson's research on sales behavior analytics frames this well: the goal is to connect selling behaviors directly to performance metrics, so that coaching has a clear before-and-after story. That story is what earns buy-in from reps and credibility with senior leadership.

Tools like Hyperbound Perform and Kota Activate are built around this framework. Behavioral signals from real calls, cross-deal pattern analysis, and top-performer benchmarking create the infrastructure for this coaching loop. The platform surfaces the trigger. The manager acts on it.
The path to a higher win rate is not a better dashboard. It is a sharper understanding of which behaviors move deals and which ones stall them.
Your CRM tracks volume. Your call recordings contain behavior. The gap between those two is where most teams leave win rate on the table.
Sales behavior analytics closes that gap. It gives RevOps and enablement leaders a way to move from "here is what happened" to "here is what needs to change, for which rep, starting with this specific call." That shift—from reporting to coaching, from output to behavior—is the foundation of Revenue Activation.
Stop measuring what your reps do. Start measuring how they do it.
Sales behavior analytics focuses on the quality and effectiveness of sales interactions, while traditional activity tracking measures the quantity of actions. Behavior analytics connects specific selling actions—like the types of questions asked or how objections are handled—to outcomes like win rates. Activity tracking, on the other hand, simply counts outputs (e.g., 100 calls made) without providing insight into whether those activities were effective.
Metrics like call volume, email count, and meeting count measure effort, not effectiveness. A high volume of activity does not guarantee high-quality interactions that move deals forward. Sales behavior analytics moves beyond these vanity metrics to identify the specific conversational behaviors that actually correlate with winning deals, giving you a much more accurate picture of performance.
The best way to start is by using a call intelligence or revenue activation platform to record and analyze sales conversations. This allows you to identify the specific behaviors that separate your top performers from the rest of the team. From there, you can benchmark the entire team, use specific call moments for targeted coaching, and measure behavioral improvement over time.
While it depends on the sales cycle, discovery question density often has a very strong correlation with winning deals. The thoroughness of a rep's discovery process sets the stage for the entire sale. Reps who ask more insightful, open-ended questions are better at uncovering customer pain points and building a strong business case. Other critical metrics highlighted in this article include stakeholder breadth, objection response quality, and call-to-call momentum.
You can measure objection response quality objectively by creating a scorecard that evaluates responses against a proven framework. A winning framework typically involves acknowledging the concern, reframing the issue, validating the prospect's perspective, and then offering a clear path forward. Using call intelligence tools to automatically flag common objections, managers can then score responses against this structure and identify coaching opportunities at scale.
The key is to use behavioral data as a trigger for specific, constructive coaching conversations, not as a surveillance tool. Instead of just reporting that a rep's talk ratio was high, a manager can point to a specific moment in a call recording and collaboratively explore how asking a different question could have improved the outcome. This approach is supportive and developmental, focusing on improving skills rather than just monitoring activity.










Use Cases
Legal