
It is week seven of the quarter. You are in a QBR. The dashboard shows pipeline coverage has slipped from 3.5x to 2.8x. Close rates are down. Activity volume looks fine on paper. You ask your reps what is going on. You get anecdotes. You get excuses. The meeting ends with a vague directive to "increase activity." Everyone leaves knowing the quarter is probably already lost.
This is the standard QBR. And it is broken.
The problem is not the data. It is the timing. By the time lagging indicators show up in your review, the decisions that shaped them were made weeks ago. As one sales operations leader put it on Reddit, "most teams don't have a metric problem; they have a decision problem... lots of numbers, very few that are wired to actual moves." Your QBR is full of numbers. But it does not tell you what to do today.
The fix is not a better dashboard. It is a different frame entirely. It means running your QBR on leading indicators, not lagging ones. It means shifting from a retrospective report card to a forward-looking strategy session. And it starts by understanding why the metrics you are currently tracking are the wrong ones for in-quarter decisions.
Lagging indicators confirm outcomes after they occur. They are the final score of a game that is already over. Most QBRs are built entirely on them.
Here is what that looks like in practice:
Quarterly revenue. The ultimate lagging metric. By the time it is reported, every deal that shaped it is already won or lost.
Close rate / win rate. Tells you how your team performed historically. Does nothing to predict whether the deals currently in your pipeline will close.
Pipeline coverage. This one feels actionable. And it is important. One sales leader noted that "pipeline coverage is the only one that ever makes us shift budget or change hiring mid-quarter." But coverage is a volume signal, not a quality signal. A 3x pipeline filled with stalled, single-threaded deals is not a healthy pipeline.
Activity volume. Dials, emails, meetings booked. These metrics are easily gamed. As one sales professional said directly: "Everything else can be faked." Activity numbers tell you reps are busy. They do not tell you whether that activity is moving the right deals forward.
The core drawback is this. These metrics reflect the past. Managing your team based on them alone is like driving by looking only in the rearview mirror. You cannot steer with stale data. And you cannot coach to outcomes that have already been determined.
Leading indicators are predictive. They track the causes of performance early in the sales cycle, giving you a 60 to 90 day warning about where revenue is heading. That is enough time to intervene.
Here is what leading indicators actually look like for a CRO running a pipeline review:
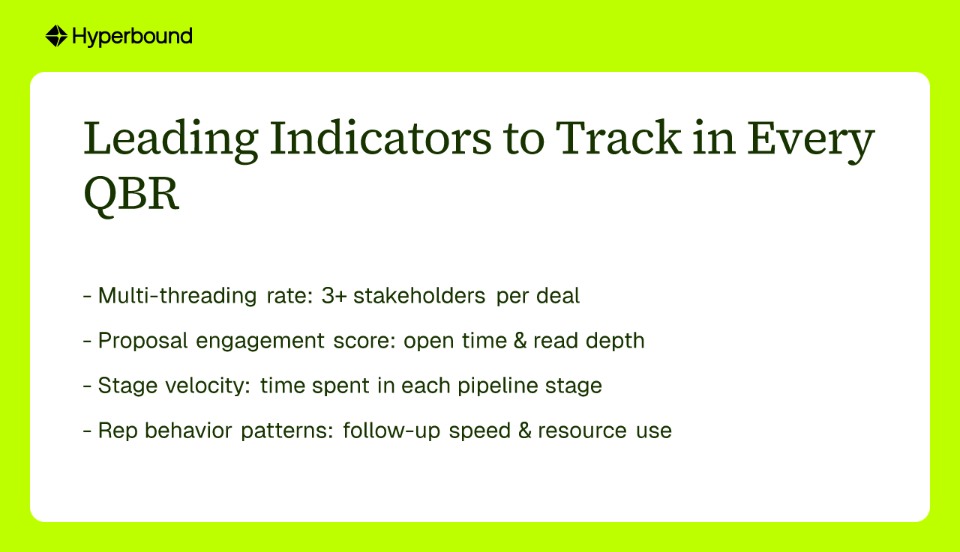
Multi-threading rate. What percentage of your active deals involve three or more engaged stakeholders? When this number drops on a deal, that deal is at risk. Not maybe at risk. At risk. Single-threaded deals die quietly. This is one of the most reliable early warning signals in B2B sales.
Proposal engagement score. How prospects interact with your proposals is highly predictive of close likelihood. Research shows proposals opened within 24 hours and read for 8 or more minutes close at a 67% rate. Proposals opened after five days and read for less than two minutes close at just 9%. That gap is actionable if you see it in time.
Stage velocity. The average time a deal spends in each stage. A slowdown in a specific stage is an early warning that your forecast is at risk. Cross-deal analysis, a core feature of platforms like Hyperbound Perform, makes this visible. You can see whether one rep is stalling at the same stage across multiple accounts, which points to a skill gap, not a market problem.
Rep behavior patterns. Are your reps following up quickly after key meetings? Are they bringing in the right resources at the right time? Revenue Activation Platforms track these behavioral signals automatically, allowing you to identify coaching needs before the pipeline dries up, not after.
As one sales ops practitioner recommended, every metric you track should answer a clear question: "Who owns this? What will they do differently if it goes up, down, or stalls?" If you cannot answer that question, the metric does not belong in your QBR.
The goal is not to eliminate your QBR. It is to change the questions you ask inside it. The format shift is simpler than it sounds.
Stop asking: What happened last quarter?Start asking: What signals are we seeing right now, and what do they tell us to do this week?
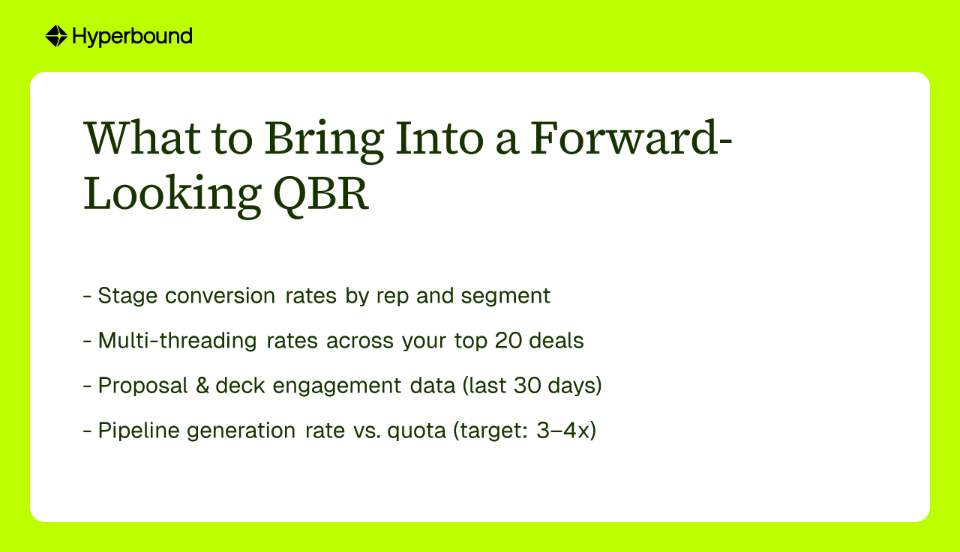
Here is the data to bring into a forward-looking QBR:
The right conversation in a QBR is not about blame. It is about plays. It is about proactive moves, not reactive fixes. What specific actions will each deal owner take this week? What does the CRO need to clear to make those actions possible?
That is a strategy session. That is a QBR worth having.

Here is a hypothetical that is closer to reality than it might seem.
A CRO is in week seven. Her team's Revenue Activation Platform, Hyperbound, flags that on three of her top rep's largest deals, the active stakeholder count has dropped from four contacts to one. Proposal engagement across those same deals is under sixty seconds average read time. The deals are still in the pipeline. They are not marked at risk. But the behavioral data says otherwise.
In the old QBR, this CRO would have seen a revenue forecast number and told the manager to get the rep's activity up. Nothing would have changed.
In the new QBR, she has a different conversation. She asks: on the Acme and Globex deals, we have lost contact with the VP of Engineering and the CFO. What is the plan to bring them back in this week? What value story do we need to tell them to re-engage at their level?
The rep knows exactly what to do. The manager has a specific coaching point. The CRO has cleared time to get involved directly on the Acme deal as an executive sponsor. The deals move. The quarter is recoverable.
That shift, from outcome data to behavioral signals, is what separates a QBR that changes the quarter from one that documents its failure.
This is not theory. Atul Raghunathan, Head of Sales at Hyperbound, implemented this exact operating cadence with his own team using Hyperbound Perform. By tracking leading indicators and using cross-deal analysis, his team closed its strongest quarter ever. The difference was not just a better dashboard; it was a shift to an operating model where coaching decisions were made in week five, not after the quarter closed.
The same pattern holds at the rep level. When managers use behavioral data to see which reps are struggling to navigate complex buying committees, they can intervene with targeted training. Using a tool like Hyperbound Practice, they can instantly generate an AI roleplay that lets the rep practice with a digital twin of their exact buyer, built from their LinkedIn profile. They get the coaching they need before deals stall, not after.
Your team does not have a metric problem. It has a decision problem.
Traditional QBRs hand you a stack of lagging indicators and ask you to find the insight buried inside them. By the time you do, the quarter is already written. You are presenting a post-mortem dressed up as a strategy meeting.
Leading indicators change what is possible. Deal momentum signals, multi-threading rates, stage velocity, and rep behavioral patterns are the inputs that give you time to act. A Revenue Activation Platform is built to surface these signals automatically, turning the QBR from a review into a plan.
The question to ask yourself after every QBR is simple. Did this meeting tell me what to do today? If the answer is no, you are running on the wrong data.
The best QBR does not tell you what went wrong last month. It tells you what to do this week. And it gives your team a fighting chance to finish the quarter on their terms, not the data's.
The main problem with traditional Quarterly Business Reviews (QBRs) is their focus on lagging indicators—metrics that report on past results that can no longer be influenced. This approach turns the meeting into a retrospective report card rather than a forward-looking strategy session, making it difficult to make timely decisions that can impact the current quarter's outcome.
The key difference is timing and predictability. Lagging indicators, like quarterly revenue or close rates, measure past performance and confirm outcomes after they've happened. In contrast, leading indicators, such as multi-threading rates or proposal engagement, are predictive metrics that track activities early in the sales cycle, giving you time to intervene and influence future outcomes.
The most important leading indicators focus on deal health and rep behavior. Key metrics to track in your QBR include the multi-threading rate (how many stakeholders are engaged per deal), proposal engagement scores (how prospects interact with your documents), stage velocity (how quickly deals move through the pipeline), and specific rep behavior patterns like follow-up speed after key meetings.
To make your QBR more forward-looking, shift the central question from "What happened last quarter?" to "What signals are we seeing right now, and what do they tell us to do this week?". Focus the discussion on leading indicators like stage conversion rates, multi-threading on key deals, and recent proposal engagement data. This allows you to identify risks and create actionable plans for the coming weeks.
Multi-threading is a critical leading indicator because single-threaded deals are extremely vulnerable. If your single point of contact leaves the company, goes on vacation, or gets deprioritized, the deal stalls or dies. Tracking the number of engaged stakeholders per deal provides an essential early warning signal about the health and resilience of your most important opportunities.
While a CRM is a starting point, it often struggles to surface real-time behavioral signals automatically. To track leading indicators effectively, teams often use a Revenue Activation Platform like Hyperbound. These platforms are designed to automatically capture and analyze signals like proposal engagement and multi-threading, surfacing deal risks and coaching opportunities before it's too late.
Leading indicators provide specific, objective data points that transform sales coaching. Instead of vague feedback like "increase your activity," a manager can see that a rep's deals are consistently stalling at a specific stage (a stage velocity problem) or that they are failing to engage multiple stakeholders (a low multi-threading rate). This allows for targeted coaching on specific skills that will directly impact pipeline health and performance.










Use Cases
Legal