
Your 1:1 is in 30 minutes. Your rep is missing quota — again. You've got a CRM dashboard full of numbers staring back at you, but none of them are telling you why things are falling apart. Do you go in with generic advice? Push harder on activity? Hope something clicks?
That approach doesn't work — and deep down, you already know it. As one sales manager put it on Reddit: "You need to get to know them, understand what success is to them and then make it your mission to get them there." The goal isn't to walk in as a know-it-all. It's to walk in with the right diagnosis.
This playbook gives you a repeatable, three-step diagnostic process built on rep performance analytics — from the symptoms on the surface all the way down to the root cause in the conversation itself. Let's get into it.
Lagging indicators are your starting point, not your finish line. They tell you that a problem exists — not why. Think of them as the fever, not the infection.
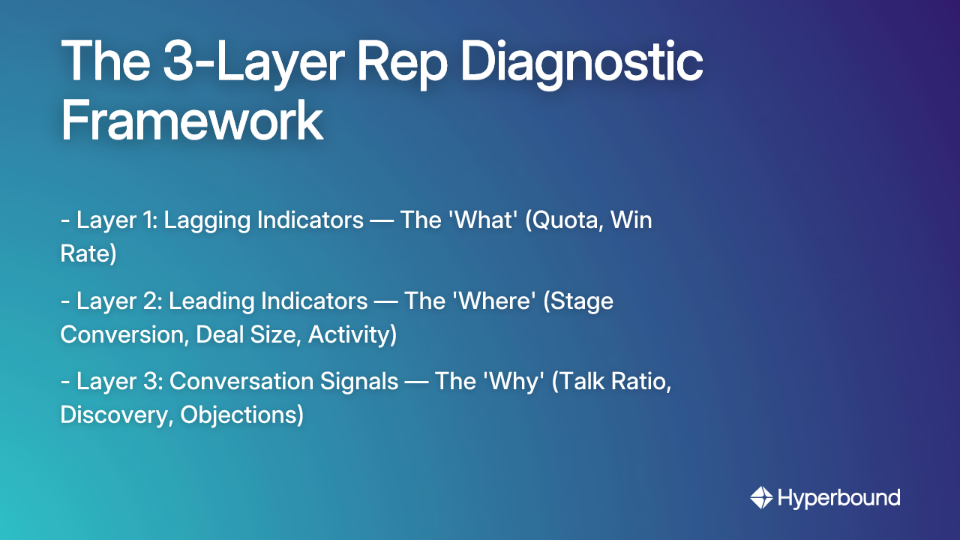
This is the most visible signal: the percentage of their assigned quota the rep has actually closed. If they're at 60% of target with one week left in the quarter, something is broken. But "something is broken" is not a coaching plan. It should prompt you to investigate further, not stop the diagnosis. Think of it this way: lagging indicators give you the scoreboard, not the game film.
Win rate is the percentage of opportunities the rep works that end in closed-won. A rep who is constantly generating pipeline but never closing it has a fundamentally different problem than a rep who closes well but isn't prospecting enough. Low win rate paired with healthy pipeline activity points toward late-stage execution issues — qualification gaps, weak demos, poor value communication, or inability to navigate the final buying committee.
Together, these two metrics confirm you have a problem. Now you need to find out where in the process it lives.
Leading indicators are the engine beneath the results. They tell you which part of the sales process is broken — and that's where most managers should be spending more of their diagnostic time.
This is the single most powerful metric for pinpointing where performance breaks down. Look at your rep's pipeline conversion data stage by stage: MQL → Discovery → Demo → Proposal → Closed. As one RevOps practitioner noted: "Look at conversion rates. They show how well leads turn into customers. Focus on stages with the biggest drop-off." (source)
If a rep converts well from MQL to Discovery but falls off a cliff between Demo and Proposal, that's a precision diagnosis. The problem isn't their outreach. It's something happening inside the demo. That's a very different coaching conversation than "you need to make more calls."
If your rep is closing deals but consistently landing below the team average on deal size, they may be over-relying on discounting, failing to build enterprise-level value, or not engaging the right economic buyers. A struggling rep's pipeline often looks healthy on the surface — it's the quality of those opportunities, reflected in deal size and cycle length, that exposes the real issue. A rep hitting 90% of their deals at 60% of average deal size is a value-communication problem, not a volume problem.
Raw activity metrics — number of calls made, emails sent, meetings booked — aren't indicators of quality, but a sudden drop in volume can signal something important: burnout, motivation issues, poor time management, or a rep who has quietly disengaged. Use activity data as an early warning system, not as a primary KPI. If everything else looks fine but activity has tanked, that's a coaching conversation about mindset and momentum — not skill.
At this point in the diagnostic, you know that there's a problem (lagging indicators) and where it's likely occurring (leading indicators). But you still don't know why. For that, you need to go deeper.
This is where most managers hit a wall. Your spreadsheet has done its job — it's pointed you toward a stage. But CRM data and pipeline reports can't tell you what's actually happening inside those calls. That requires analyzing the conversations themselves.
The problem? You can't listen to every call. As managers already feel, "even a simple summary helps a lot when you've got tons of calls to go through." (source) Manually sampling 2-3 calls per rep per week is not a diagnostic strategy — it's a lucky guess.
This is exactly where AI-powered rep performance analytics change the game. Instead of relying on random call samples, Hyperbound Perform deploys AI scorecards across 100% of your rep's real customer conversations — automatically scoring every call against your custom methodology and surfacing the specific behaviors that are hurting (or helping) deal outcomes. It's not just "call recording with a summary." It's structured, scalable conversation intelligence that moves you from the what to the why.
Here's what to look for once you have that visibility:
Top-performing reps typically talk around 40% of the time and listen 60%. A rep who dominates conversations — hovering at a 70/30 or 80/20 talk ratio — isn't doing effective discovery. They're pitching instead of problem-solving. AI call analytics research consistently identifies talk-to-listen ratio as one of the strongest behavioral predictors of call quality. If your rep's ratio is off, that's a discovery discipline problem — not a product knowledge problem.
How many high-quality, open-ended questions is your rep asking per discovery call? Research suggests that the optimal range sits between 12–15 questions per call. Reps who ask too few questions are either rushing toward the pitch or haven't internalized a discovery framework. Poor discovery leads directly to misaligned demos, generic proposals, and deals that stall out because the rep never uncovered real business pain. This is one of the most common hidden drivers of low win rates — and it's completely invisible in a CRM report.
AI-powered call scoring can automatically tag and categorize every objection a rep encounters — and more importantly, how they respond. The insight here isn't just "did they handle the objection" — it's pattern recognition at scale. Does your rep consistently fold when pricing comes up? Do they go quiet when a competitor is mentioned? Are they failing to re-anchor on value? As one practitioner put it: "The biggest value is just spotting patterns you don't catch by listening — like which objections come up the most or what messaging lands best." (source)
That kind of pattern visibility, across every call, is what separates a data-driven coaching conversation from a gut-feel guess.
.png)
Insights are worthless without an intervention. Once you know the why, the job is to connect it to targeted practice — fast.
Here's how the loop works with Hyperbound:
This isn't theoretical. Companies running this feedback loop see measurable results: 50% faster ramp times, 2x faster time to first won deal, and Vanta cut their ramp time from 210 days to 72 days — a 60% reduction — while growing their BDR team 4x.
The key differentiator: spreadsheet analytics stop at the what. Call-level scoring, powered by AI, surfaces the why. Practice closes the gap.
Use this before your next 1:1 with a struggling rep. Work through it in order — each layer informs the next.
✅ Step 1: Lagging Indicators — The "What"
If both are low → proceed to Step 2
✅ Step 2: Leading Indicators — The "Where"
Note the stage where things break down. That's where you focus next.
✅ Step 3: Conversation Signals — The "Why" (powered by Hyperbound Perform)
✅ Step 4: Targeted Action — The "Fix" (powered by Hyperbound Practice)
The 3-step diagnostic process involves analyzing lagging indicators (the "what"), leading indicators (the "where"), and conversation-level signals (the "why") to get a complete picture of a rep's performance. You start with outcome metrics like quota attainment to confirm a problem exists. Then, you trace it to specific pipeline stages using metrics like conversion rates. Finally, you analyze the calls themselves for behaviors like talk-to-listen ratio and objection handling to uncover the root cause.
Lagging indicators are output-oriented results like quota attainment and win rate, while leading indicators are input-oriented activities and process metrics like stage conversion rates and activity volume. Lagging indicators tell you the final score, confirming a problem. Leading indicators show you where in the process you struggled, pointing you to the area that needs fixing.
CRM data is excellent at telling you what is happening (e.g., low win rate) and where it's happening (e.g., deals stall after the demo stage), but it cannot tell you why. Your CRM dashboard can't reveal if a rep is failing to ask enough discovery questions, talking too much, or struggling with competitor objections during the demo. Without understanding the why behind the numbers, any coaching you provide is just a guess.
The most effective way to find the root cause is by analyzing the rep's actual customer conversations for specific behavioral patterns. Manually listening to a few calls is not scalable or reliable. Using an AI-powered conversation intelligence tool allows you to automatically score 100% of calls against a consistent methodology, surfacing patterns in talk ratios, discovery depth, and objection handling that are invisible in CRM data.
Three of the most impactful conversation metrics to track are talk-to-listen ratio, the number of discovery questions asked, and objection handling patterns. A healthy talk-to-listen ratio is around 40/60, indicating the rep is listening more than talking. Top reps ask between 12–15 open-ended discovery questions per call. And tracking how reps handle recurring objections reveals critical skill gaps.
AI automates the analysis of 100% of sales calls, providing scalable, objective data on rep behaviors that managers can use to deliver precise, targeted coaching. Instead of relying on random call samples and subjective feedback, AI scorecards can automatically identify the exact moments a rep struggles. This allows managers to move from generic advice to specific, actionable feedback based on data.
Connect diagnosis to improvement by creating a continuous coaching loop: identify a specific skill gap from call data, assign targeted practice on that skill, and then measure the next real call to see if the behavior changed. For example, if AI scoring reveals a rep struggles with pricing objections (the diagnosis), you can assign a roleplay scenario focused on that objection (the practice) and then use AI to score their next real call involving pricing to measure progress.
The rep sitting across from you in your next 1:1 doesn't need motivational platitudes. They need a manager who has actually done the diagnostic work — who can say, "I looked at your calls, and here's exactly what I'm seeing."
That level of precision isn't possible when you're relying only on CRM fields and gut instinct. By layering lagging indicators → leading indicators → conversation-level signals, you get a complete picture of the performance gap and — critically — you know what to do about it.
Hyperbound is the Revenue Activation Platform that makes this diagnostic automatic and scalable. Perform scores every real call so nothing slips through the cracks. Practice gives your reps a risk-free environment to close the gaps that scoring surfaces. Together, they turn rep performance analytics from a reporting exercise into a genuine coaching engine.
The managers who win aren't the ones with the most data. They're the ones who know how to read it — and act on it fast.









Use Cases
Legal